
This piece draws on work completed as part of an MSc dissertation in partnership with Kainos, building a cross-modal disruption prediction pipeline using UK open transport feeds. The pipeline is publicly available at github.com/nehavadapally/master-dissertation-project.
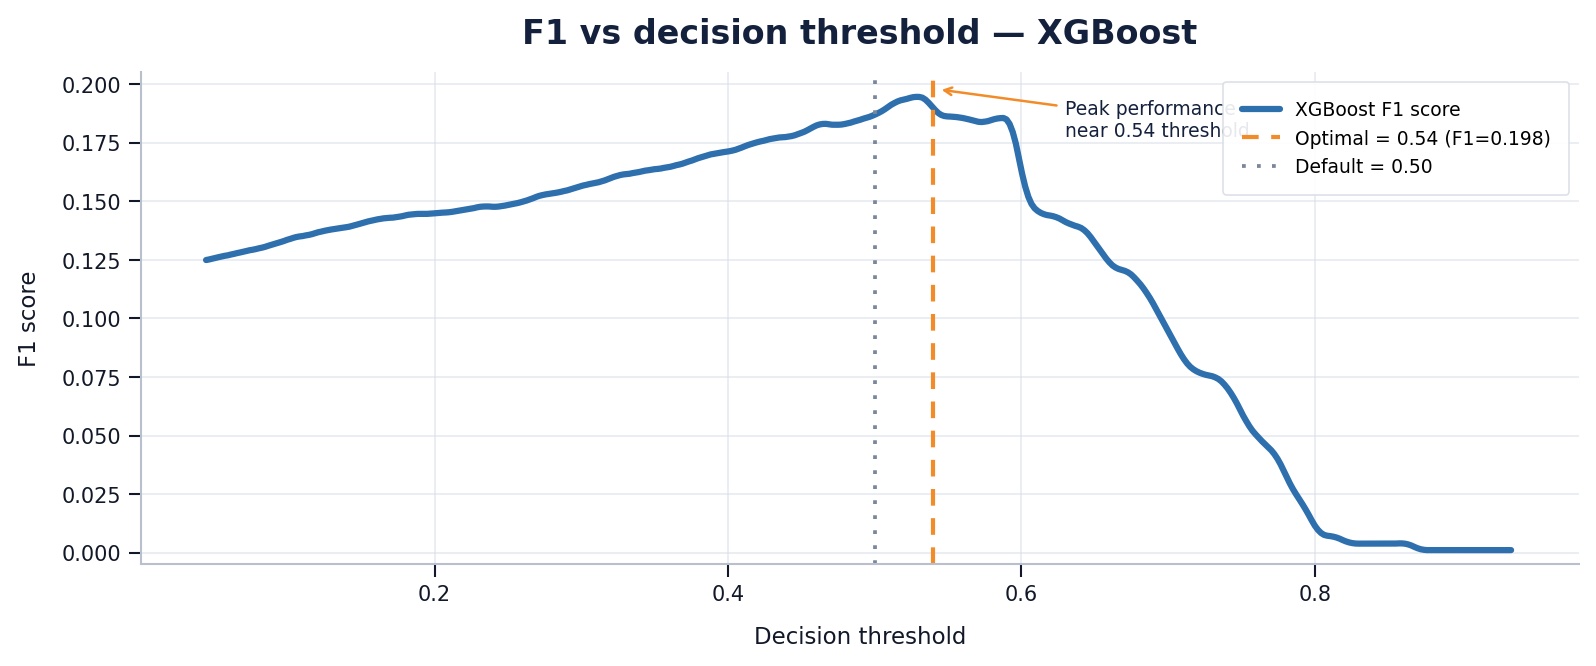
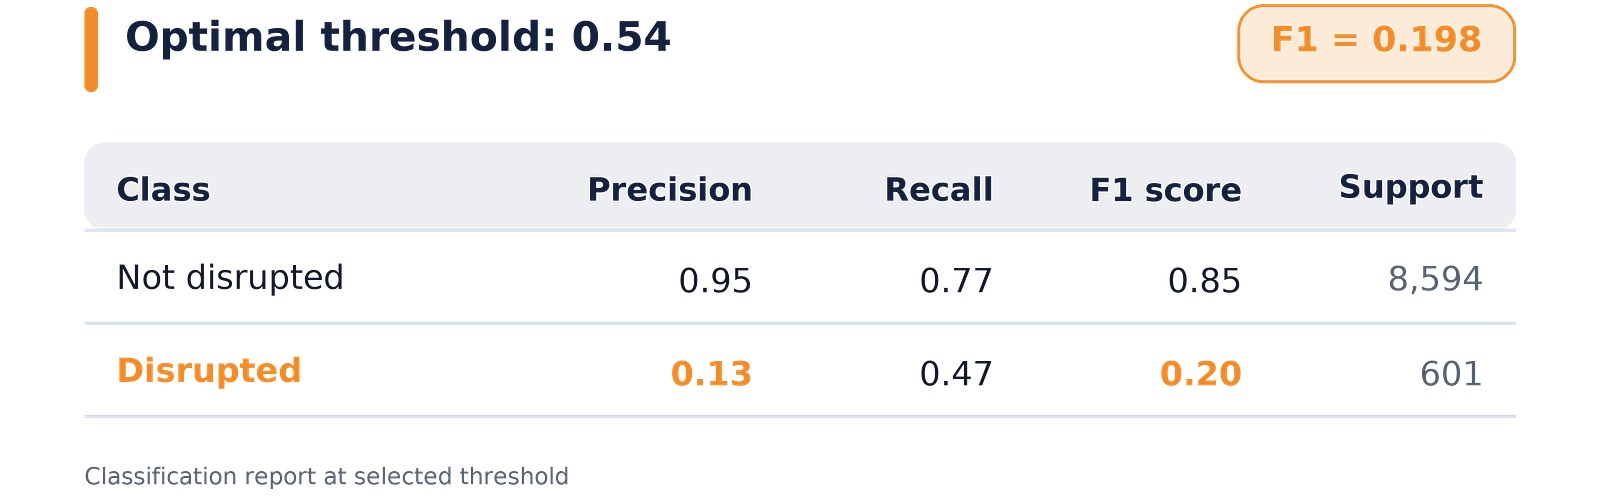
A PR-AUC of 0.123 against a random baseline of 0.065 sounds underwhelming on its own. At the optimal decision threshold of 0.54, the classifier achieves 13% precision on the disrupted class, which means seven false alerts for every genuine one, well short of anything you would deploy operationally. But readiness was never really the point. The real question is whether the underlying data holds a signal at all.
Getting the target right mattered more than the model
Before any classifier was fitted, disruption had to be defined, which meant finding a threshold that cleared two bars: rare enough to mark a genuine departure from normal running, and common enough to leave enough examples to learn from. The first threshold tested, sub-minute mean arrival delay, failed the first bar outright — it was indistinguishable from ordinary operating noise once spread across the full station-day dataset. Five minutes cleared both: high enough above the noise floor to mean something, while still capturing roughly 5 to 6% of station-days depending on the split, enough to keep the classification task workable.
That threshold also sets the class balance the model must work with. The training set carried a disruption rate of 5.32%, the test set 6.54%, which makes accuracy a useless metric here, since predicting "not disrupted" for every station-day would already be right over 93% of the time. Precision-Recall AUC was the right choice instead, because it stays sensitive to the minority class in a way ROC AUC does not — and ROC AUC would have made this result look considerably stronger than it is.
Precision is not the whole story
Thirteen percent precision sounds like the model is mostly wrong, but recall tells a different part of the story. On the test set, the model correctly identified 47% of all genuinely disrupted station-days, nearly half. So the model is not failing to find disruption; it is finding a real share of it while also flagging many false positives along the way. That trade-off — catching close to half of real disruptions at the cost of several false alerts per genuine one — is the actual operating point, not just the precision figure in isolation.
Consistency across models is the real evidence
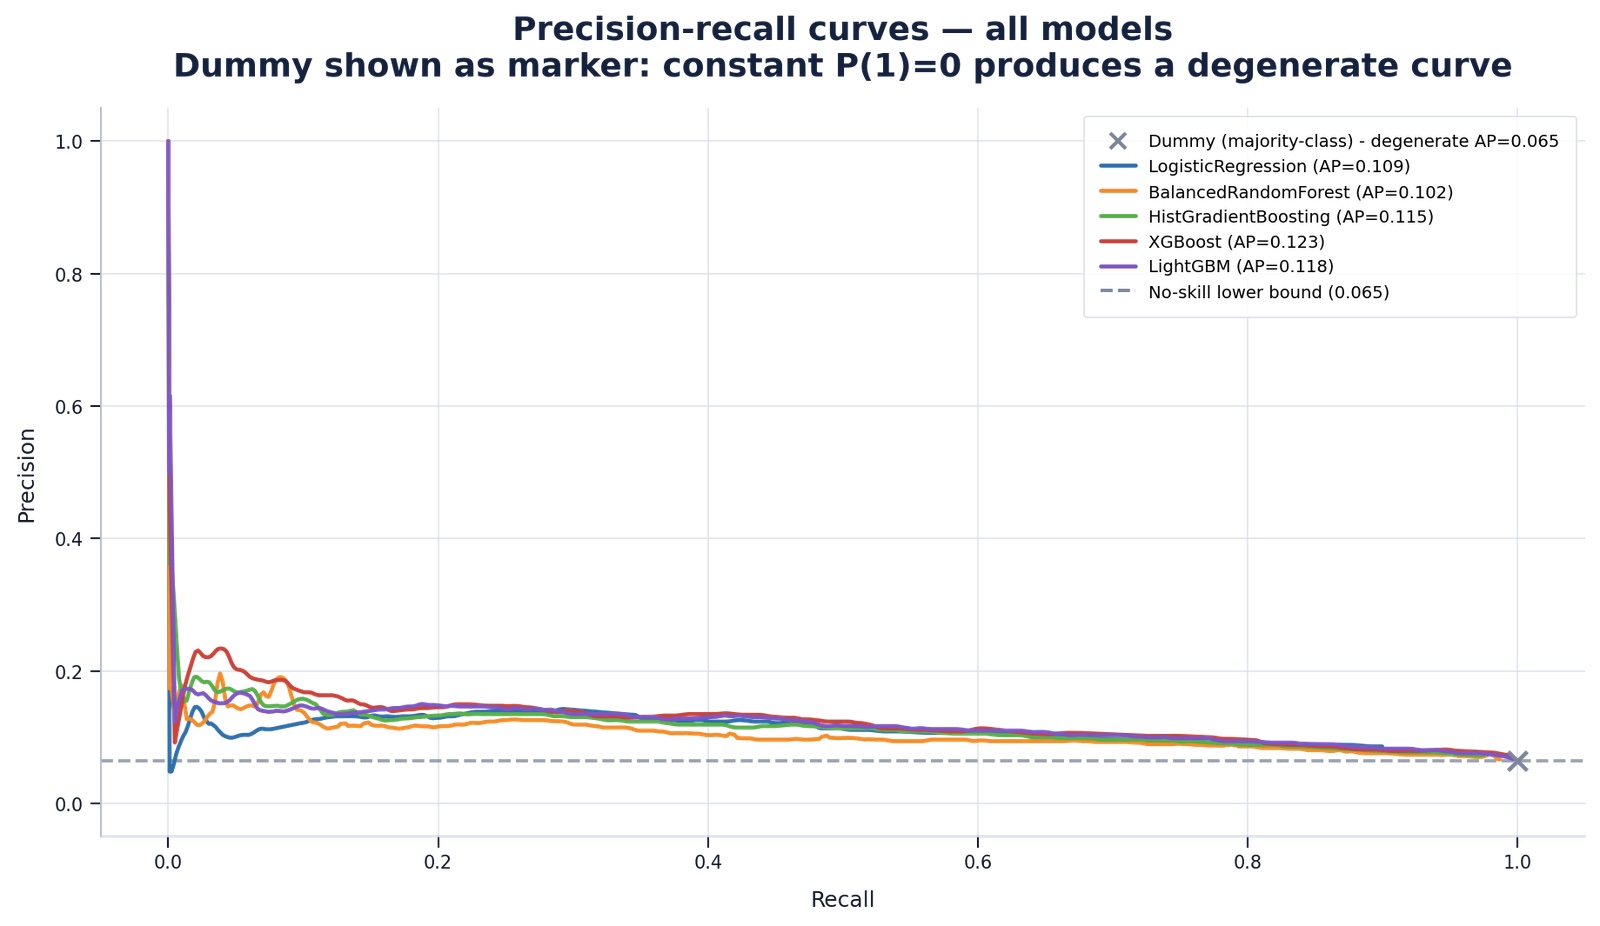
Model selection is the common next move when a result disappoints, but it only helps if the estimator is the constraint. XGBoost reached 0.123, LightGBM 0.118, HistGradientBoosting 0.115 and Logistic Regression 0.109, all clearing the 0.065 baseline by a similar margin — including a linear model with none of the tree-based interaction terms the other three rely on. Five distinct models converging on the same range points to a structural property of the feature set, not a constraint of any single model's configuration or capacity. A sixth model would be unlikely to change that outcome.
What the feature ranking reveals
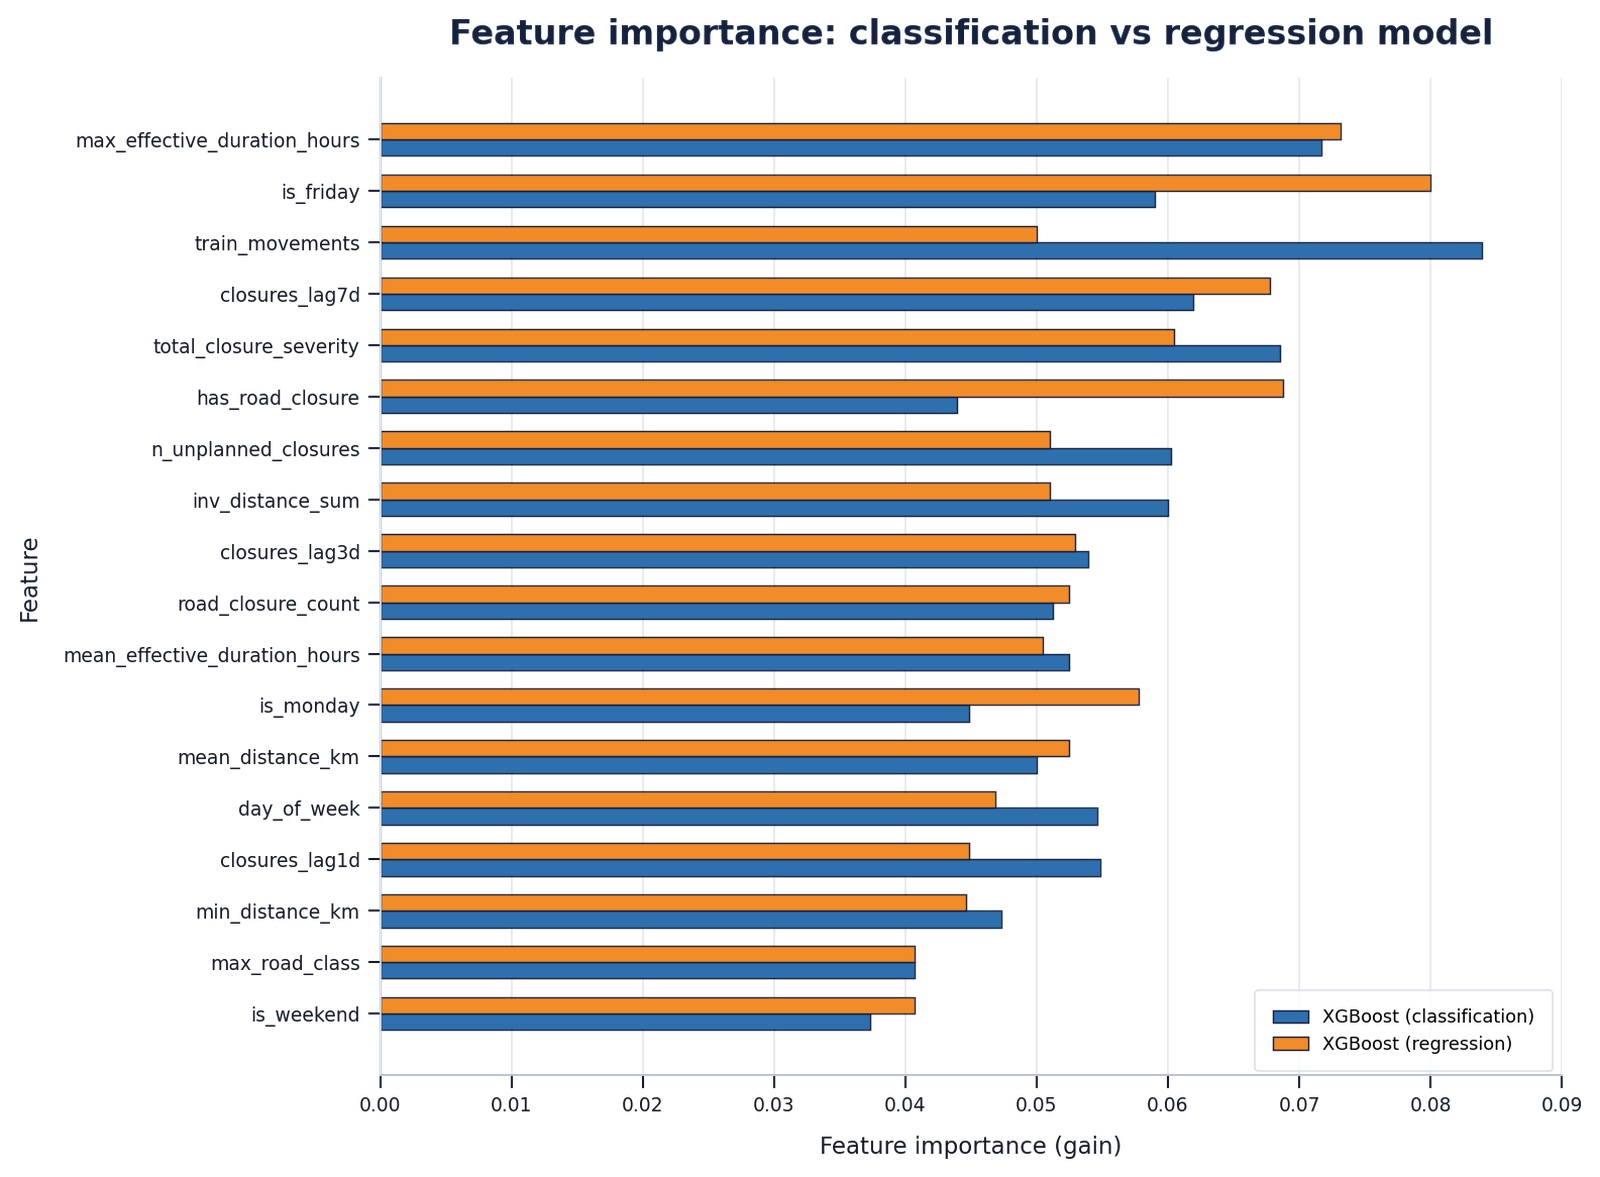
The selected XGBoost classifier placed train_movements first by gain at 0.084, ahead of max_effective_duration_hours at 0.071, total_closure_severity at 0.068 and closures_lag7d at 0.062, with has_road_closure — the simple binary flag for whether any closure was active nearby — sitting near the bottom at 0.044.
Read together, this says the model leans most heavily on how busy a station normally is, then on how long and how severe nearby closures were, and only weakly on whether a closure was simply present at all. The low importance of the binary flag suggests delay variation is driven more by closure severity, duration and how long disruption has persisted than by the mere fact that a closure exists nearby.
The companion regression model, which predicts delay magnitude in minutes rather than a disrupted-or-not flag, ranks features differently: is_friday comes out on top there, with has_road_closure rising to third place and train_movements dropping well down the list. That is not the same model viewed two ways; it is two different prediction tasks producing two different rankings, which is itself worth noting. A feature that barely matters for predicting whether disruption crosses the five-minute threshold can matter more for predicting how large the delay is once it occurs.
What a weak result rules out
A PR-AUC of 0.123 on eighteen days of spring data, at station-day resolution, without passenger volume information, rules out one specific thing: that station-day aggregation with open data alone is sufficient for operational deployment as it stands. It does not rule out that a real cross-modal effect exists.
The eighteen-day window was a practical limit of continuous polling rather than a deliberate choice, and every source kept returning data well beyond it, which points toward a longer collection period, finer temporal resolution and station-level passenger volume as plausible directions for closing that gap — though which of those matters most is still an open question rather than a settled answer.
The pipeline is the deliverable, not the score
The lasting contribution here is not the PR-AUC. It is a working, reproducible method for joining DATEX II, TRUST and Darwin at national scale using only open UK data, something that did not exist documented anywhere before this. The negative finding gives the next attempt a clearer starting point, which is precisely the kind of result a proof of concept is supposed to produce.